Our regular May traffic count, at Lothian Road and Forrest Road, found bikes up everywhere: northbound and southbound, morning rush hour and lunchtime. With car numbers fairly static compared to last year, bikes rose to 19.2% of all vehicles in the morning and 12.3% at lunchtime, our highest post-pandemic figures. At Forrest Road, morning bikes formed 31% of all northbound vehicles, almost one in three.
Parallel counts by Spokes Porty members found the highest ever number of bikes during both time periods, whilst analysis of automatic counter data by Edward Tissiman (below) has found substantial 2026 bike use growth on Leith Walk.
Interestingly, car single-occupancy in our central area count fell to its lowest ever level, although that was not the case at Portobello.
Overall, both car and commercial vehicle (van, taxi, bus) numbers largely fell or were static at all count points other than lunchtime at Lothian Road, where both rose significantly (bike numbers also rose there, though less so).
Recent years have seen much larger rises in bike use where new infrastructure was in place as compared to smaller rises at our count points. However, this year it is great to see that, whilst numbers continue to rise on the new Leith Walk/Picardy bike lanes, we are also finding substantial rises at our traditional count points. Clearly one or more new factors are in play this year, quite separate from, and additional to, the impacts of new segregated bike lanes. We speculate below on what these new factors might be.
- For full data from our May 12 count, including from Spokes Porty, see the ‘Resources’ section below
- Of course, our counts are just snapshots on one day. However, to maximise comparability, we always use the same day of the week (Tuesday), same time of year and same locations
Overall results, Lothian Road + Forrest Road
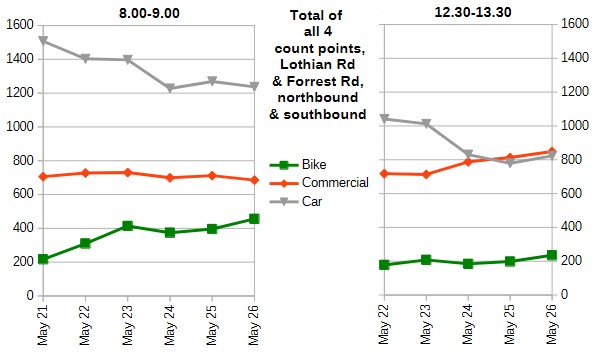
The overall picture since our post-covid counts began is of increasing bike use (particularly a.m.) and falling car use, with commercial numbers unchanged in the morning but rising at lunchtime. Detailed numbers are in the table below.
| Totals at Lothian Rd & Forrest Rd northbound+southbound, 8-9am | May 2021 | May 2022 | May 2023 | May 2024 | May 2025 | May 2026 |
| Bikes | 217 | 310 | 414 | 374 | 396 | 456 |
| Commercial (bus, taxi, van, etc) | 706 | 728 | 730 | 699 | 712 | 685 |
| Private car | 1507 | 1403 | 1397 | 1227 | 1269 | 1237 |
| Bikes as % of total traffic | 8.9% | 12.7% | 16.3% | 16.3% | 16.7% | 19.2% |
| % of cars which are single-occupant | 76.4% | 77.7% | 77.0% | 74.3% | 77.1% | 73.4% |
| northbound+southbound 1230-1330 | ||||||
| Bikes | no count | 178 | 208 | 184 | 198 | 235 |
| Commercial (bus, taxi, van, etc) | 718 | 713 | 788 | 813 | 849 | |
| Private car | 1041 | 1012 | 839 | 779 | 823 | |
| Bikes as % of total traffic | 9.2% | 10.8% | 10.2% | 11.1% | 12.3% | |
| % of cars which are single-occupant | 70.1% | 70.3% | 67.0% | 71.6% | 63.9% |
Why the rise in bike numbers?
Bike numbers rose consistently at all count points, as compared to May 2025. Overall up 15% from 396 to 456 in the morning, and up 19% from 198 to 235 at lunchtime. The Porty count (on one road only, see below) combining morning and lunchtime, had bikes up by 15%, from 94 to 108.
With very similar weather for our 2025 and 2026 May counts, clearly one or more new factors lie behind the increases. We have two suggestions…
Voi hire bikes
With the bike hire scheme launching in September 2025, expanded 3 times subsequently, and including all our 4 central area count points, this is a likely contributory factor.
Whilst we did not think of counting Voi bikes separately, one of our count volunteers did make a note of this and found that 10 of his 148 bike total were Voi bikes. Given this, and the reported success of the Voi scheme, it does seem likely that Voi played a part in the overall rise. However, note that Voi is not yet available in Porty, which saw a fairly similar % rise in bikes, albeit at a much lower baseline, so Voi is unlikely to be whole story.
Middle East turmoil, and public concerns over rising petrol and other prices
It is possible that some motorists are beginning to try out cycling for their normal daily journeys, whether to work, or for shop or lunch visits, because of concerns over petrol and other price rises – and the growing expectation of further rises on the way giving an incentive to break existing habits. This could help explain why bikes rose in Voi-less Porty as well as in the central area.
This theory gets further backing from the reduction we saw (below) in single-occupancy car use: are more people turning to car-sharing due to the same concerns over costs?
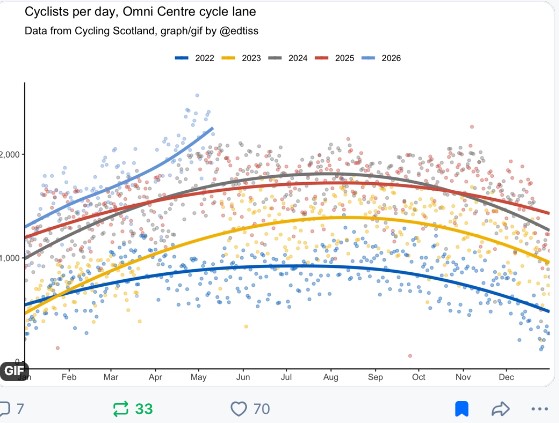
The Ed Tissiman graph later in this article, using data from the Leith Walk Omni Centre automatic counter, adds further evidence, with the growth in bike use accelerating noticeably in April 2026.
[added 28 May] Research from London adds to the evidence, suggesting that “nearly one in three London drivers say they are either cycling more or seriously considering it due to rising petrol prices.” An April YouGov survey commissioned by Cycling UK gives a similar picture.
Lothian Rd v Forrest Rd
In the morning, both roads showed substantial rises in bike use and a small fall in car numbers. Commercial traffic was unchanged at Lothian Road, but fell somewhat at Forrest Road.
At lunchtime, bikes again rose everywhere, but the picture for other vehicles was different, with car and commercial up significantly at Lothian Road, but down significantly at Forrest Road.
LEZ impacts ?
Our 4 count points all fall within the LEZ boundary. Our May 2025 report concluded that the LEZ (in addition to its main intention, to reduce toxic and climate emissions) had probably reduced traffic volumes by some 10%-20%. With car numbers remaining, overall, fairly static this year, that LEZ reduction appears to have been maintained.
Single Occupancy
Single-occupancy means a huge area of valuable streetspace occupied to move just one person, though even a full car is of course space-inefficient compared to bus, bike or walk. Our counts this year found significant, reductions in single occupancy.
As can be seen from the table below, single occupancy was lower than every other year post-pandemic, this being particularly marked at lunchtime. Whilst the differences are not huge, the consistency suggests a genuine change. In the previous subsection we speculated as to whether this results from increasing petrol and other costs and/or the need to change habits as further cost pressures seem very likely.
| Average at all 4 count points | 2021 | 2022 | 2023 | 2024 | 2025 | 2026 |
| Morning, 08.00-09.00 | 76.4% | 77.7% | 77.0% | 74.3% | 77.1% | 73.4% |
| Lunchtime, 12.30-13.30 | no count | 70.1% | 70.3% | 67.0% | 71.6% | 63.9% |
An interesting point is the number of people travelling solo citybound in the rush hour. We estimate, at our count points, this was around 830 people (318 by bike; ~512 alone in a car) so cyclists comprised 38% of people travelling solo, whilst occupying a far lower proportion of roadspace. Allocating a relatively small width of the roadspace to a segregated bike route should encourage many more of these space-efficient machines, as is now happening at CCWEL and Picardy Place.
Evidence from the Picardy Place Omni automatic bike counter
Publicly available data from Cycling Scotland has shown remarkable growth in bike use on roads in Edinburgh and Glasgow where segregated facilities of significant length were built between 2022 and 2024, as we highlighted in our 2025 count report.
By 2025 there was little further new infrastructure to come in this area and whilst existing high cycle numbers remained, continued growth largely stalled until the end of 2025, when it resumed, and has accelerated noticeaably in April/May 2026. This data further supports our speculation, first, that the Voi hire bikes have brought more cycling, and, second, that the Middle East crisis is now having a growing impact on bike use.
Our big thanks to Ed Tissiman for analysing this data and posting this graph.
Portobello count
Spokes Porty does a traffic count in Brighton Place at the same times as our City Centre counts. See ‘Resources’ below for links to the full data.
With much lower numbers than the central area counts, combining the morning and lunchtime figures, as in the table here, should give totals somewhat less susceptible to random fluctuation.
| Brighton Place totals 8-9am + 1230-1330 | May 23 | May 24 | May 25 | May 26 |
| Bikes | 75 | 84 | 94 | 108 |
| Commercial (includes bus, taxi, van) | 185 | 165 | 220 | 159 |
| Cars | 600 | 642 | 610 | 601 |
| Bike % of all vehicles | 8.7% | 9.4% | 10.2% | 12.4% |
Generally, the figures have much similarity to our city centre count, with a 15% increase in bike numbers and little change in total car numbers. Whilst commercial fell substantially from the 2025 count, the 2025 figure now looks something of an outlier, with 160-190 looking more like the normal range.
Resources …
- Our Bluesky post of this article – please repost!
- Count data page for all data, the central area trends file, and previous surveys
- Quick link to our full City Centre May 2026 count data
- Reports on our previous two counts, November 2025 (the ‘rainy day’ count) and May 2025
- The covid pandemic brought major changes in commuting patterns, as many people began working from home, and many bus/rail users are thought to have changed to car. This early major change, and its impact on numbers and trends at that time, which may still be influencing traffic patterns to some extent, was discussed in our count article of November 2020
- Edinburgh Reporter article [25.5.26] about our count