

Spokes traffic count Nov 2026
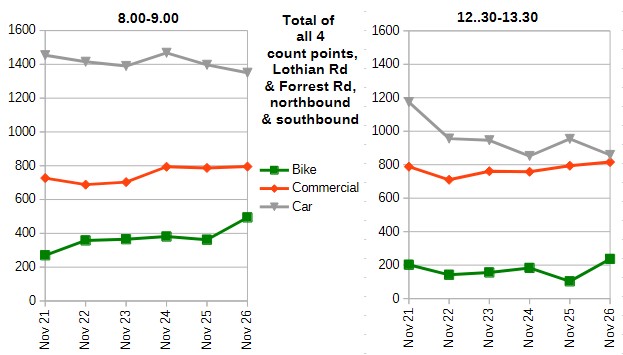
Our regular November traffic count, at Lothian Road and Forrest Road, found a similar pattern to our May count – bike numbers rising at every count point! And, whilst car numbers had stayed fairly static over the 12 months to May, their long-term downward trend continued in the November count. The graph below shows November totals over that 5-year period, 2021 to 2026. For full data, see the links in ‘Resources’ below.
Citybound on bike-hostile Lothian Road, bikes formed a remarkable 19.2% of all 8-9am vehicles, the highest ever percentage in November – or even in May! Meanwhile at Forrest Road, up from the Meadows Cycleway, 25.9% of vehicles were bikes in that morning peak period.
There is evidence that the large improvements (bikes up, cars down) both in May and in November this year are due in part to the cost of living crisis – see below – whilst the introduction of Voi bike hire is likely also significant.
Differences from the November 2025 count
Although cars were down substantially overall, they rose somewhat at Forrest Road, but declined quite steeply at Lothian Road. Adding northbound and southbound they were up from 573 to 634 at Forrest Road, but down from 824 to 716 at Lothian Road. In addition to the general reduction in car use, this contrast probably reflects changing driver patterns following the complete re-opening of North Bridge.
You may notice, on the lunchtime graph, a very significant drop in bike numbers in the 2025 November count. This was due to a massive downpour – see Rainy Day Traffic Count. The numbers this year confirm that the 2025 figures were just a blip in the trend
Cost of Living Crisis
It seems likely that some motorists are trying out cycling for their normal daily journeys, whether to work, or for shop or lunch visits, because of concerns over petrol and other price rises – and the growing expectation of further rises on the way giving an incentive to break existing habits. Our May report gave several pieces of evidence pointing to this, and the November count backs this up.
In particular, like May, car single-occupancy was down at all 4 count points, both morning and lunchtime, suggesting that drivers (and passengers) are trying harder to minimise travel costs – which could mean more car sharing as well as more cycling. Overall, single occupancy in the morning period was down from 78.5% in November 2025 to 75.0% in 2026, and from 71.9% to 65.3% at lunchtime, quite significant falls.
Voi bike-hire
Voi bikes (launched in central areas in September 2025, and subsequently expanded to much of the city) will also have played a part in the rising bike numbers. We did not attempt to count Voi bikes separately, although one volunteer did note this down at Lothian Road, finding 24 Voi out of 214 bikes in total, 11%. A volunteer did similar in May, coming up with 7%, suggesting a continuing rise in Voi use since May, although these figures are very limited.
The comparison with our September east-west Princes Street and George Street counts is interesting, where Voi was much more prominent, averaging at around 25% of all bikes (a similar figure to Ed Tissiman’s Leith Walk rough estimate). Different factors may be in play for trips approaching the city centre from the south or from east/west.
Car numbers falling
The picture of car numbers falling, at least in central areas, ties in well with Council data.
A controversy over this topic came up at the Council’s Nov 12 Transport Committee, following the report entitled City Mobility Plan – 2026 Review. Appendix 1 revealed that data from the UK Department for Transport shows a reduction in car-km of only 2% between 2019 (the agreed baseline) and 2025, whereas the Council’s target is 30% reduction between 2019 and 2030. However the DfT indicates that although its data should be robust at regional level, it may be less accurate at local level, and Councils should include their own data where available. Edinburgh does not have comparable car-km figures, but does have number of cars data for a large number of automatic count points around the city, though these are more densely located in central areas. They show a reduction of 16% in car numbers over the same time period, with reductions at nearly all count points, but particularly so at central area counters.
The differences were discussed in the Spokes deputation (4.11-4.19), where we concluded that the two sets of figures were measuring very different things, and it was quite feasible that both are reasonably accurate. Certainly, our own counts (in central areas) do concur with the Council’s own data showing significant falls in car numbers.
Controversially, the Committee decided to replace the car-km target (which could conceivably be reached but only by some form of road user charging) with a new target (still tough, though far less tough) to reduce car numbers by 30% (using those count points which have been operating since 2019). Spokes had asked unsuccessfully that both sets of data and targets should be used, with more exploration of reasons for the differences.
Our Porty count data (below) also shows a slight decline in car numbers in November 2026, but less so than the central area counts. Although this is very limited data it does tie in with the suggestion above that car use has fallen significantly more in central areas than in outer parts of the city.
The impact of segregated bike infrastructure
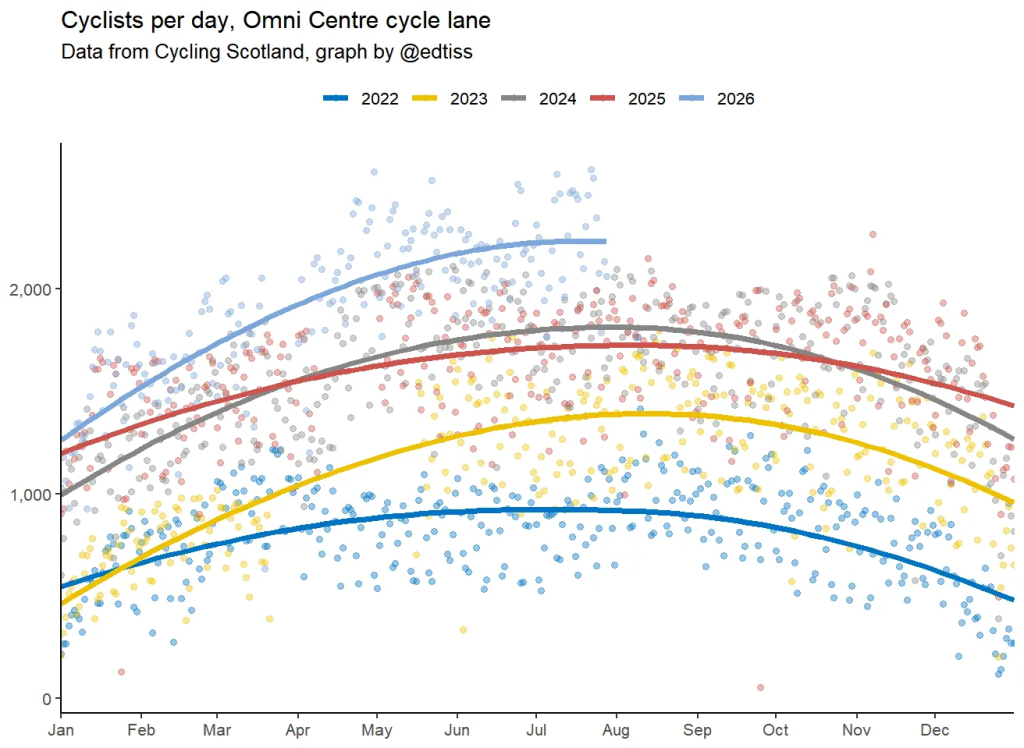
We always like to compare our count data with that obtained by the expert Ed Tissiman, who has a genius for extracting official figures, presenting them in a clear and helpful manner, and identifying results which sometimes defy conventional wisdom (e.g. 1, 2). Ed regularly reports on the increase in cycle use on the Leith Walk segregated bike lanes, with his latest graph below, again showing much larger rises in bike use than the rises identified in our own counts.
We can only repeat our long-standing conclusion, in comparing his and our counts. It is indeed possible to get significant rises in bike use for a wide range of reasons, including health, environment, campaigning, growing public awareness, e-bikes, bike-share schemes, and so on. However the greatest increases can be achieved through bike lanes segregated from motor traffic, so that even novice, nervous, and child cyclists can feel, and can be, safe.
Overall results data, Lothian Road + Forrest Road
This table shows the data used to construct the graphs at the start of the article. As stated already, the overall picture since our post-covid counts began is of increasing bike use (particularly a.m.) and falling car use, with small rises in ‘commercial’ numbers (bus, taxi, van etc).
| Totals at Lothian Rd & Forrest Rd northbound+southbound, 8-9am | Nov 2021 | Nov 2022 | Nov 2023 | Nov 2024 | Nov 2025 | Nov 2026 |
| Bikes | 270 | 358 | 365 | 381 | 362 | 494 |
| Commercial (bus, taxi, van, etc) | 727 | 688 | 703 | 794 | 787 | 795 |
| Private car | 1454 | 1415 | 1390 | 1468 | 1397 | 1350 |
| Bikes as % of total traffic | 11.0% | 14.5% | 14.8% | 14.4% | 14.2% | 18.7% |
| % of cars which are single-occupant | 75.4% | 74.0% | 75.5% | 75.9% | 78.5% | 75.0% |
| northbound+southbound 1230-1330 | massive downpour! | |||||
| Bikes | 202 | 142 | 156 | 183 | 103 | 237 |
| Commercial (bus, taxi, van, etc) | 788 | 710 | 761 | 758 | 794 | 816 |
| Private car | 1174 | 1041 | 956 | 852 | 954 | 858 |
| Bikes as % of total traffic | 9.3% | 7.9% | 8.4% | 10.2% | 5.6% | 12.4% |
| % of cars which are single-occupant | 69.7% | 67.6% | 70.5% | 70.3% | 71.9% | 65.3% |
Portobello count
Spokes members in Portobello conduct a traffic count in Brighton Place at the same times as our City Centre counts.
With much lower numbers than the central area counts, combining the morning and lunchtime figures, as in the table below, should give totals somewhat less susceptible to random fluctuation on the overall position. See ‘Resources’ below for links to the full data.
The picture for motor vehicles (car and commercial) is somewhat complex. In particular, November 2021 looks an outlier on motor vehicle numbers – possibly some road restrictions were in place at that time? The unusually low numbers of all motor categories also boosted the bike percentage perhaps misleadingly. Disregarding that year, the figures show a fairly static picture for car numbers over the period, until a noticeable decline in 2026, whilst ‘commercial’ only changed slightly throughout.
Bike numbers rose, over the same period, by over 25%, whilst bikes as a % of all vehicles rose from 8.4% to 10.8%..
| Brighton Place totals 8-9am + 1230-1330 | Nov 2021 | Nov 2022 | Nov 2023 | Nov 2024 | No count in Nov 2025 | Nov 2026 |
| Bikes | 71 | 72 | 70 | 95 | 91 | |
| Commercial (includes bus, taxi, van) | 144 | 177 | 189 | 207 | 196 | |
| Cars | 491 | 612 | 598 | 633 | 558 | |
| Bike % of all vehicles | 10.1% | 8.4% | 8.2% | 10.2% | 10.8% |
Thanks
Many thanks to organiser Guy, and all our count volunteers – thank you for getting up early and/or disrupting your normal lunch routines!
Resources
Cautionary note … Our counts are just snapshots on one day. However, to maximise comparability, we always use the same day of the week (Tuesday), same time of year and same locations
- Our Bluesky post of this article – please repost!
- Count data page for all data, the central area trends file, and previous surveys
- Quick link to our full November 2026 count data, central and Porty
- Reports on our previous two counts, November 2025 (the ‘rainy day’ count) and May 2026
- The covid pandemic brought major changes in commuting patterns, as many people began working from home, and many bus/rail users are thought to have changed to car. This early major change, and its impact on numbers and trends at that time, which may still be influencing traffic patterns to some extent, was discussed in our count article of November 2020