Update Jan 2017: The Evening News printed a further article on Jan 2, concentrating on the fall in motor traffic. This was widely picked up on social media and received worldwide publicity, with many popular tweets e.g. this 88-RT, 114-likes tweet. We took advantage by replying to several tweets to give a link to our own article.
Our November traffic count, averaged over our 4 regular count points, found bikes forming 16.4% of all vehicles – our highest ever November percentage. Bikes comprised 22.2% of all citybound vehicles, and 8.9% southbound.
The total number of bikes rose by 4.5% compared to November 2015, whilst private cars fell by a dramatic 10% to their lowest ever level since our counts began in 2006.
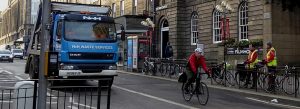
As usual, we counted bikes, cars and commercial vehicles in both directions on Lothian Road and Forrest Road, on the second Tuesday in November, during rush hour. All figures below are for the 8-9am peak hour.
See the full count data and trends from 2006 to the present on our traffic counts page.
LONG TERM TREND
Compared to our first ever November count, in 2006, bikes are up 34% from 335 to 448, whilst cars are down 28% from 2141 vehicles to just 1535.
This is a success for the Council, which has a bold Local Transport Strategy target to cut car use from 43% of all trips in 2010 to just 31% in 2020, and car commuting from 42% to 29%. The long-term trend of rising cycling and declining city centre car commuting in our counts also ties in with trends in the 2011 census.
There has been very little change in commercial vehicle numbers over recent years [our count lumps together buses, taxis, vans and lorries].
Once again most cars, 74%, have only one occupant – a huge waste of precious roadspace in the heart of the city. The 2011 Edinburgh census data confirms this picture, and additionally shows that many of the multi-occupant cars are on the school run. Therefore single-occupancy commuting is almost certainly significantly worse than our 74% figure. Despite this overall picture, there was a remarkable change at Forrest Road – see below.
LOTHIAN ROAD
Lothian Road saw the least change from last November, with a small rise in bike use and a small fall in cars – bikes comprising 19.8% of citybound vehicles. This level of cycling demand surely cries out for protected cycling provision on this relatively wide, but scary, city-centre road. There are few roads in the city which would benefit so strongly from such a scheme and, as shown by the London superhighways [video1][video2], there is almost certainly a big pent-up further demand from people who’d like to cycle but don’t feel safe until they have the right conditions.
FORREST ROAD – A CAR CONUNDRUM
In Forrest Road bikes also rose, from 237 to 254, but private cars fell drastically in both directions, from a total of 784 in 2015 to just 629 this year. Commercial vehicle numbers hardly changed. As a result, bikes formed 24.6% of citybound vehicles and a record 13.3% southbound. [Incidentally, the Meadows public bike counter recorded 302 at 08.20 and 641 at 09.20, a total of 339 bikes in both directions – though of course it counts a different sample from our count, which is further north].
Not only did cars decline dramatically at Forrest Road but, within that, we identified a remarkable shift away from single occupancy (though single occupancy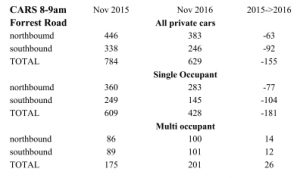 still remains by far the norm). Whilst the total number of cars fell by 155, the number of multi-occupant cars actually rose by 26, meaning that single occupant cars fell by 181.
We can see no obvious explanation – the ‘school run’ may be implicated but, if so, why is this year different to previous years? It is unlikely to be a systematic error by our volunteer counters since the same pattern emerged on both sides of the road, with different people counting. And we did not see the same pattern at Lothian Road. Could it even be a one-off statistical quirk?
WHAT NOW??
The Council should take every advantage of its success to speed up its plans to boost cycling (as well as walking and public transport). The continuing decline in car numbers makes it much easier than 10 years ago to re-allocate roadspace. The planned East-West segregated route should be progressed robustly; and there is an ever stronger case for protected cycle facilities on Lothian Road and from the Meadows to Princes Street.
If you agree – why not speak to or email your councillors?? Tell them about the survey results, and what you’d like to see happening now.