Our November 2018 traffic count, averaged over our 4 regular count points, found bikes forming 16.8% of all vehicles – the highest ever November percentage, up from last year’s 16.5%, and almost equalling the 16.9% in our summer (May) count.
Bikes comprised 23.4% of all citybound vehicles and 9.0% southbound – both our highest ever November figures.
The overall picture was a modest improvement on last November, with only a marginal rise in the total number of bikes (up 3 to 471) but a continuing fall in private motor traffic, resulting in the highest ever bike percentage.
As usual, we counted bikes, cars and commercial vehicles in both directions on Lothian Road and Forrest Road [north of Bristo triangle] on the second Tuesday in November, during rush hour. All figures in this article are for the 8-9am peak hour.
See the full count data and trends from 2006 to the present on our traffic counts page.
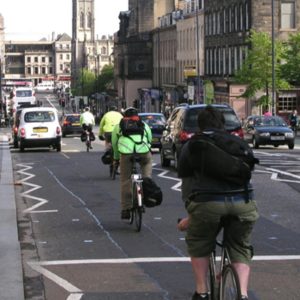
Lothian Road: Chris Hill photo
LONG TERM TREND
Compared to our first ever November count, in 2006, bikes are up 41% from 335 to 471, whilst cars are down 27% from 2141 vehicles to just 1558.
This is a success for the Council, which has a bold Local Transport Strategy target to cut car use from 43% of all trips in 2010 to just 31% in 2020, and car commuting from 42% to 29%, albeit the shifts we have identified are not sufficient to meet these targets. Rising cycling and declining city centre car commuting in our counts also ties in with long term Edinburgh trends compared to other Scottish cities, as in the 2011 census.
Within the overall figures, there were several differences between Forrest Road and Lothian Road – see below.
As always, most cars (75%) had only one occupant – a huge waste of precious roadspace in the heart of the city. The 2011 Edinburgh census data confirms this picture, and additionally shows that many of the multi-occupant cars are on the school run. Therefore single-occupancy commuting is almost certainly significantly worse than our 75% figure.
LOTHIAN ROAD
Car numbers were down significantly in both directions whereas bikes were up slightly citybound (to 20.6% of all vehicles) and up significantly southbound (forming 7.5% of all vehicles).
This level of cycling demand – over 20% of all vehicles citybound – surely cries out for protected cycling provision on this relatively wide, but scary, city-centre road. Our anniversary Futures Board showed what it could be like.
It is possible that the road resurfacing currently underway at Tollcross is deterring some motor traffic and/or encouraging more people to cycle. It is very disappointing that the opportunity is not being taken to introduce segregated provision. We are told that this would have been considered, under the policy to include walk and cycle improvements in maintenance projects, but resurfacing had to be brought forward due to recent unexpectedly rapid deterioration, which had to be sorted before winter. This meant too little time to undertake the legal processes (Traffic Orders) to amend parking regulations to allow space for segregated lanes. There will however be some cycling and pedestrian improvements, including advance cycle traffic lights at Bread Street crossroads, and segregated provision will be considered under the City Centre Transformation project (below).
FORREST ROAD
In Forrest Road both bike and car numbers fell citybound (bikes from 212 to 196, cars from 404 to 369), whereas southbound bike use was static but car numbers rose (from 248 to 291). Commercial traffic (vans, taxis, buses etc) was up significantly in both directions.
It is possible that the lengthy disruption and closures of Middle Meadow Walk cycleway (recently re-opened), due to Edinburgh University’s combined heat and power works, may have led some cyclists to adopt different routes or modes.
At the time of our previous November count, Leith Street was closed to motor traffic (for 10 months) but, looking at our November 2016, 2017 and 2018 counts, the impact on car and commercial traffic in Forrest Road does not seem to have been great.
WHAT NOW??
Whilst the overall picture is modestly positive, there is no sign of the transformative modal shift that the City needs to see. Perhaps this is not surprising, given that there has been virtually no new cycling infrastructure, or traffic restrictions, in the city centre in the last few years.
A huge amount will now depend on the level of ambition the Council displays when it reveals the City Centre Transformation* proposals in Spring 2019. These will determine whether we see a far more people-friendly city centre in the next few years, or yet another era of tinkering, consulting and ‘steady as she goes.’ The long-term decline in car numbers which our regular counts have identified should make it much easier than 10 years ago (practically and politically) to re-allocate roadspace.
*See also para 1810 on this page.
Of course, several individual projects are already in the pipeline – notably the planned West-East segregated route, the Meadows – George Street CL+ project (though its timescale is disappointingly lengthy), Meadows-Canal (hopefully to be built before next year’s count, but final plans still awaited), Picardy area (now under construction) and onstreet bike storage (mid 2019?). The enthusiastic reception for, and planned expansion of city bike hire, is one great step forward, and a few ‘Just Eat’ bikes were already seen during our count!
WHAT YOU CAN DO
- If there’s anything above you’d like to push, why not speak to or email your councillors?? Tell them about the survey results, and what you’d like to see happening now
- Retweet our tweet about this story.