The Spokes November traffic count found less road traffic of all types, compared to last year’s pre-Covid November. Despite a probable big transfer from bus to car, total car numbers fell. Cycling was also well down – except in the Mound to George IV Bridge direction where the Council has made substantial improvements in bike infrastructure, notably for cycling up The Mound.
Spokes conducts traffic counts citybound and outbound at Lothian Road and Forrest Road triangle each May and November. This year’s May count was cancelled due to Covid19, and the November count was masked and sanitised.
Taken over the four count points, between 8-9am, car numbers fell from 1538 in November 2019 to 1321 this year. Bikes fell from 411 to 229 and ‘commercial’ vehicles (including van, bus, taxi) from 816 to 679.
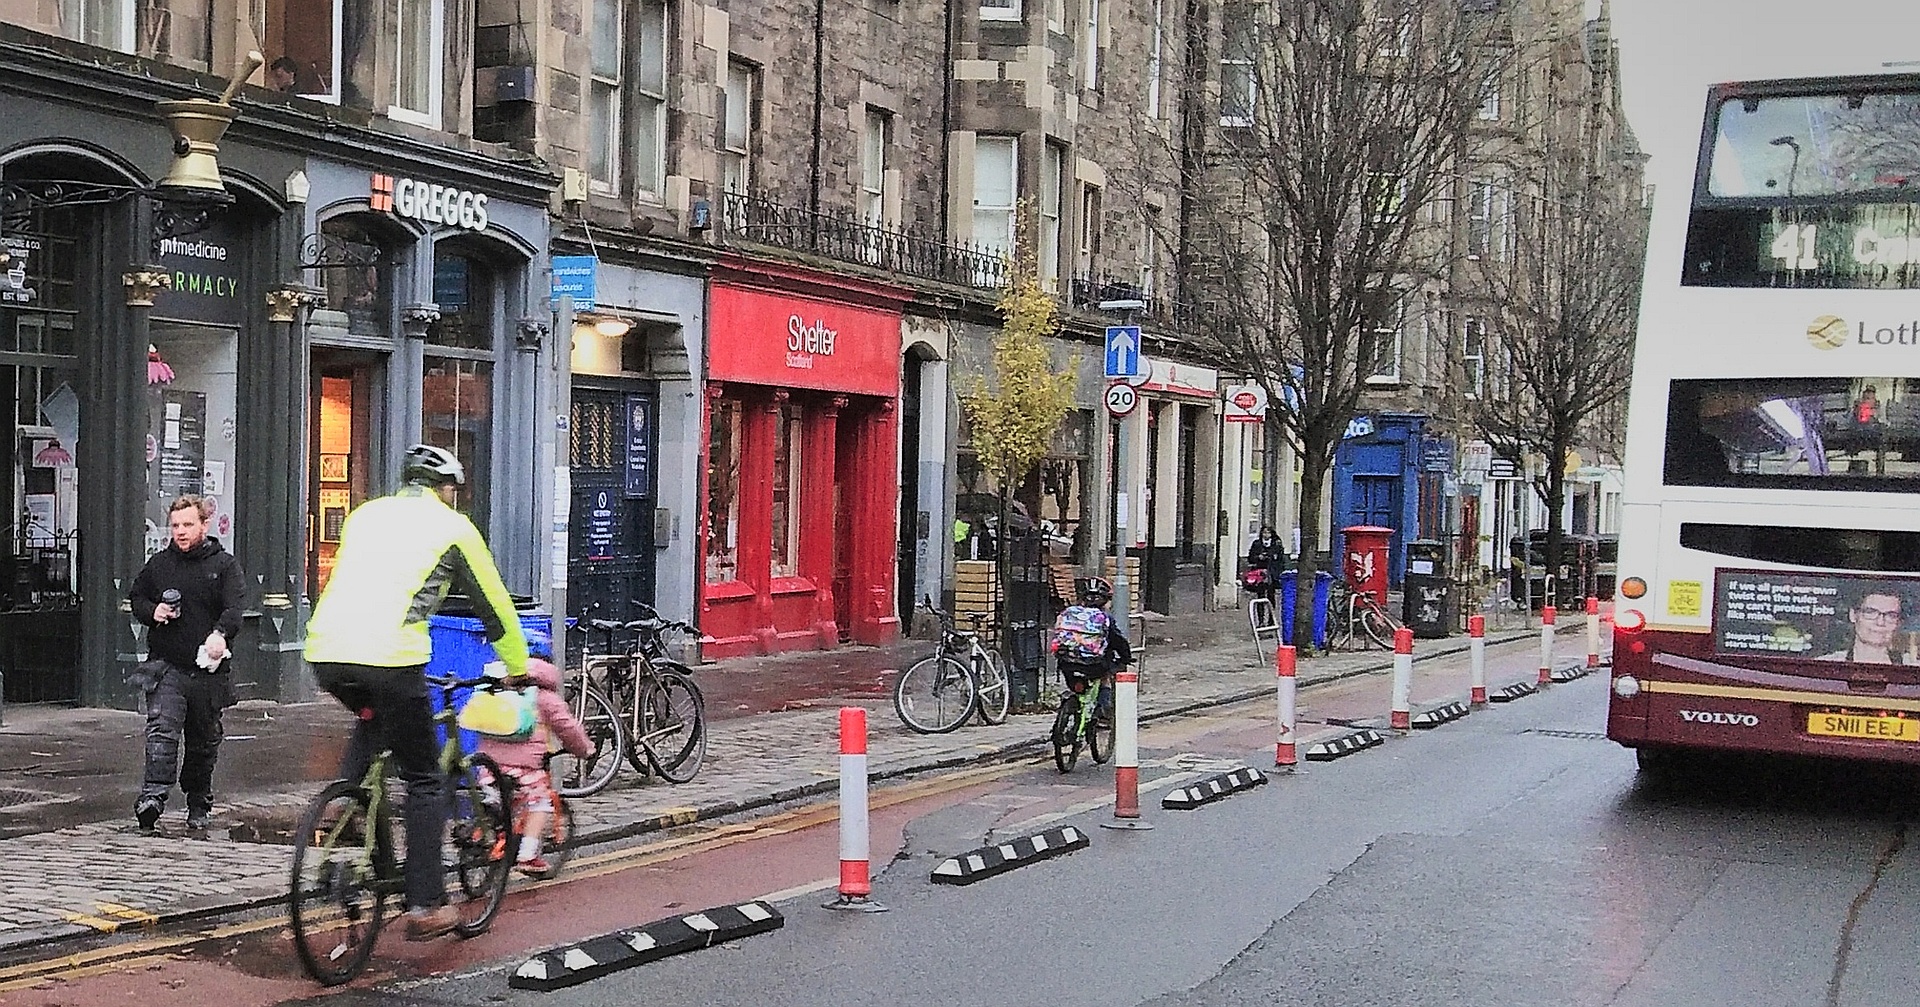
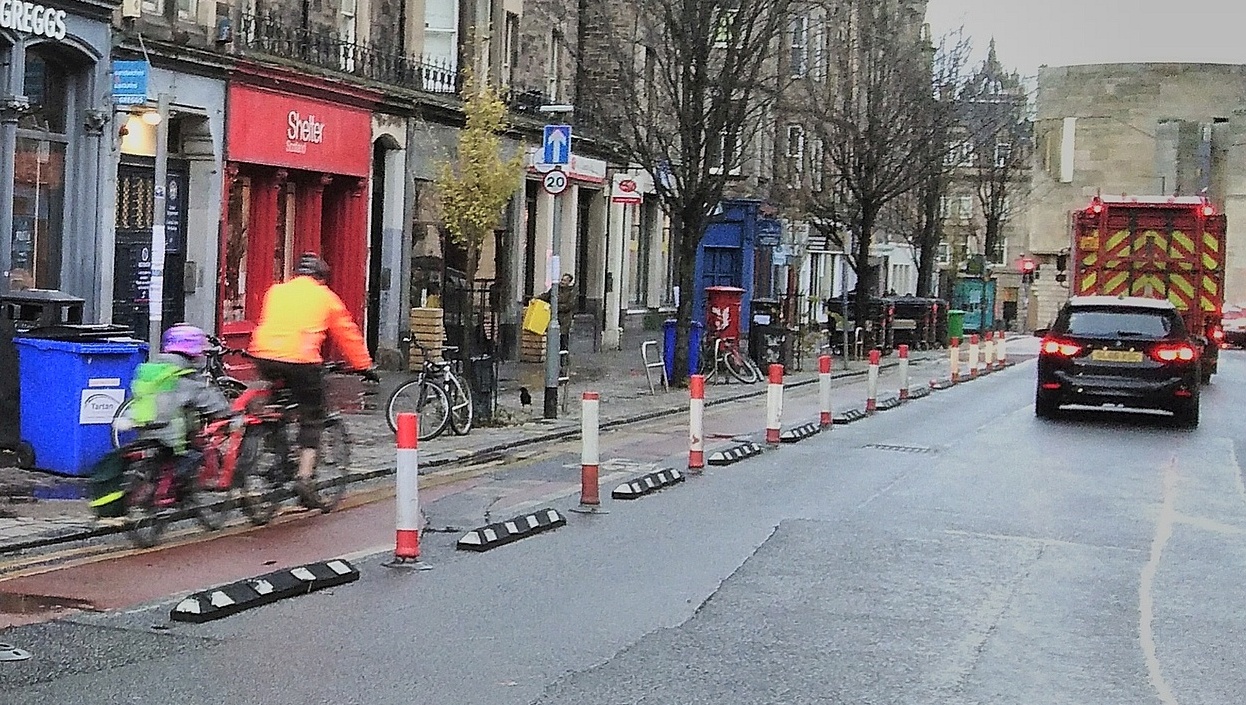
[photos: Mies Knottenbelt]
Who has shifted – and how?
Whilst our counts just give total figures, and cannot tell what modal transfers have taken place, the figures fit very well with the two assumptions below. In the appendix at the end of this article we show how this might work numerically.
- Large numbers of people have stopped travelling (between 8-9am). Many are probably working from home; others have lost their jobs or been reduced to part time; and many are following the Tier-3 travel restrictions currently in place.
- Amongst those who do still travel, many have transferred from bus to car, though not enough to fully compensate for the reductions in the previous bullet point.
In other words, motorised traffic (in our count locations) is heading back towards its pre-Covid levels, but within a context of many fewer people travelling in total. This would explain our finding that bikes formed 10.3% of all vehicles compared to 14.9% in November 2019.
If the above two assumptions are correct, there is an interesting implication that there will have been a big shift in the population of car drivers. Many former experienced car commuters no longer travel to work, but there are instead a large number of drivers on the roads who are inexperienced at car-commuting, having previously commuted by bus. This could perhaps help explain why many cyclists reported a feeling of increased road danger as car numbers started building up.
Important qualifications
Please don’t try to generalise our count results too widely. In particular…
- Our counts are in the morning peak period. Covid-related changes may be different at other times of day when people are out shopping or for leisure
- Our counts are right in the inner city. The commuting modal share situation, and changes to it, may well be different further out from the centre.
It is also possible that bike commuters have been disproportionately affected by ‘work at home’ rules. One of our regular count volunteers says that her own city centre office has around 600 staff, of whom all but 10 or so now work from home – and that is typical of many offices. If the proportion of commuters who have office jobs is higher among cyclists than for bus and/or car commuters, this could significantly affect the proportions in our recent count.
Mound to Forrest Road triangle
A fascinating aspect of our count was that although there were substantial falls in the number of bikes at 3 of the 4 count locations, the number was virtually unchanged in the Mound–>George IV Bridge–>Forrest direction (down from 58 to 57). Moreover, although car numbers fell somewhat at all 4 locations, the biggest fall (from 320 to 243) was here.
The one explanation we can think of is the greatly improved cycle infrastructure in this direction – particularly the segregated lane coming up The Mound. The Mound lane has perhaps been the biggest single cycling improvement of all the SfP measures. Previously, cycling slowly up the steep hill, with heavy overtaking traffic, particularly at the sharp left bend, and then at the narrow section further up, was hugely offputting at busy times. If the new infrastructure has persuaded some drivers and bus users to change to bike, this could well explain the figures. However, we can but speculate!
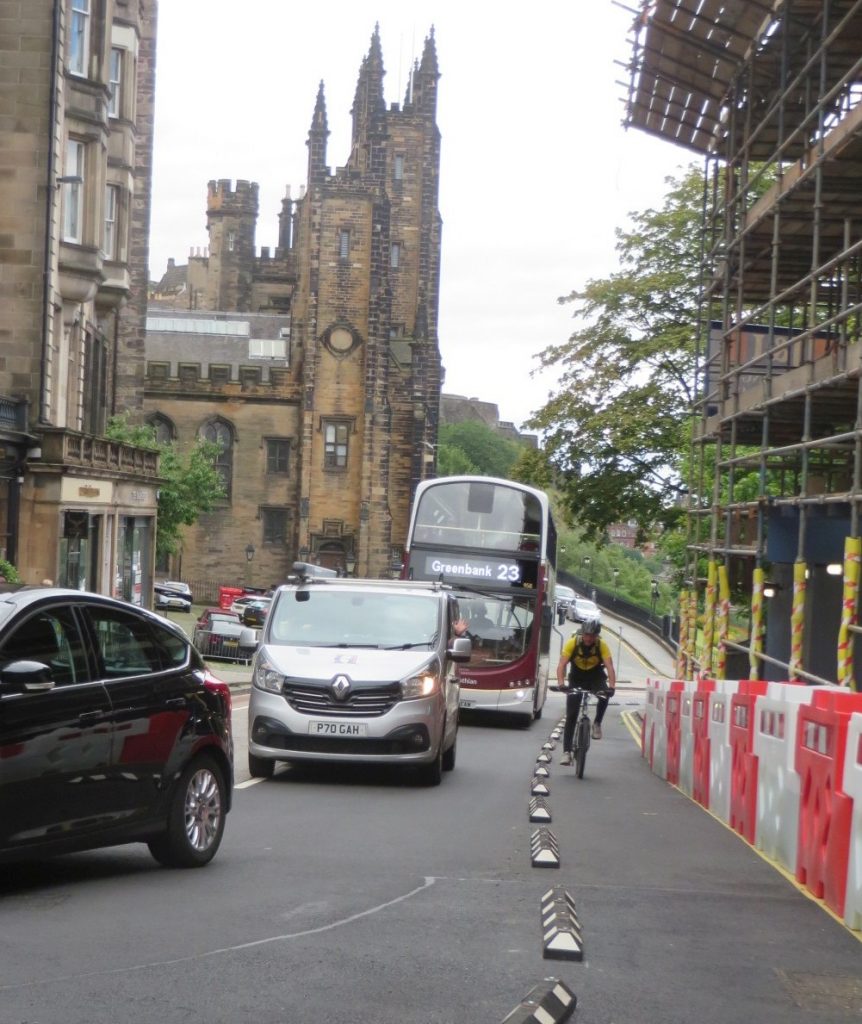
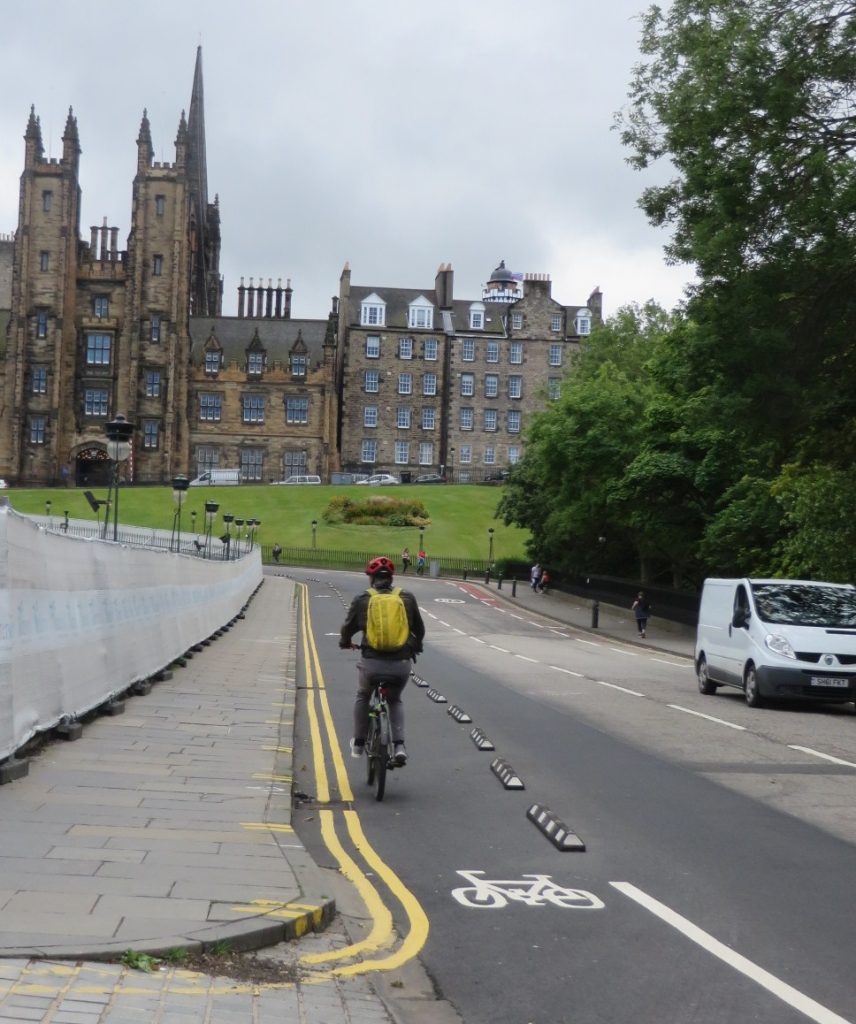
NOTE – photos are from July, before infrastructure completed [photos: Dave du Feu]
Single occupancy
With the government deprecating car-sharing we expected single occupancy to rise. It did rise, and at 79% of all vehicles was the highest ever – but not by a huge amount, with a normal figure in recent years of around 74%-78%. Southbound, it was up from 71%-72% to nearly 76%, whereas citybound at 82% it was in line with the last few years. Once again, a huge amount of roadspace is occupied to transport one person, as compared to the space required by a person cycling, walking or (in normal circumstances) using the bus.
More information
- For full details of this and our other counts, see our counts page. www.spokes.org.uk/documents/papers-documents/spokes-traffic-counts
- Please retweet our tweet about this article
Appendix – Covid count modal shift scenario
Important: This appendix shows a scenario as to how the type of changes in numbers in our count could have happened. These are not intended in any way to be definitive figures, and they also depend entirely on the assumptions shown, which may or may not be near reality. Feel free to work out your own scenario!
Assumptions
- Our November 2019 count, over all 4 locations, totalled 411 bikes and 1538 cars. For the scenario below, we therefore start with round figures of 400 bikes and 1500 cars for the pre-covid baseline
- We have no knowledge of bus numbers, but for the scenario we assume 30 full buses, say 3000 passengers pre-covid. This is probably our biggest assumption. If the real figure is much higher (or lower) then we could change some of the other assumptions below.
- We assume 60% of former 8-9am commuters no longer travel (at that time). They may be working from home, redundant, moved to part-time work, obeying Tier 3 restrictions, and so on.
- We assume that of every 100 former 8-9am bus passengers:
- 60 no longer travel
- 24 change to car
- 10 still travel by bus
- 3 change to bike
- 3 change to walk
- Walking numbers are shown as unknown. However, our concern in this scenario is to understand changes in bike and car numbers.
- We have not taken account of the fact that 20% of cars have more than one occupant, according to our count.
- There are other less obvious assumptions – for example we have assumed that whether you drive, bus, cycle or walk your likelihood of no longer travelling is the same; whereas it is quite likely that some types of job which enforce (or prevent) home working have staff who tend to travel by a particular mode.
On these assumptions, the scenario plays out as follows (the table shows the number of people travelling by each mode) …
| bike | car | walk | bus | |
| Pre-covid numbers | 400 | 1500 | unknown | 3000 |
| Assume 60% no longer travel | -240 | -900 | -60% | -1800 |
| Transfer from bus | +90 | +720 | +90 | -900 |
| Covid numbers | 250 | 1320 | unknown | 300 |
In terms of vehicle numbers, this gives the following…
| bike | car | other – bus,taxi,van, etc based on 2019/2020 counts | Total | bike % | |
| pre-covid | 400 | 1500 | 800 | 2700 | 15% |
| covid | 250 | 1320 | 700 | 2270 | 11% |
Our actual counts found bikes forming 14.9% in November 2019 and 10.3% in 2020, a good approximation to the scenario results.