The November 2021 Spokes city-centre traffic count found bike numbers up 18% from November 2020, rising from 229 to 270, totalled over our 4 city-centre count points during the 8-9am peak period. Because of increases in motor traffic, the rise in bikes as a % of all motor traffic was more marginal, up from 10.3% to 11.0%.
Totals from the 3 counts we have undertaken during the pandemic are in the table below. The weather was reasonably good for cycling on all 3 dates.
| City centre, 8-9am | Nov 2020 | May 2021 | Nov 2021 |
| Bikes | 229 | 217 | 270 |
| Commercial (bus, taxi, van, etc) | 679 | 706 | 727 |
| Private car | 1321 | 1507 | 1454 |
| Bikes as % of total traffic | 10.3% | 8.9% | 11.0% |
| Single-occupancy cars | 79.0% | 76.4% | 75.4% |
The May dip in the bike % is largely accounted for by the rise in motor traffic, with only a small fall in actual bike numbers. Presumably some people were returning to work, and some former bus users taking to the car. However it is encouraging to see no continuing rise in peak-hour city-centre car use between May and November in our count – indeed, a small reduction.
Outside the peak hour
Conversations with government statisticians and council officers suggest that bike commuting (like all commuting) has fallen as a result of the pandemic, whereas bike use during the day has probably risen. Unfortunately Spokes has not previously counted during the day, so our data cannot provide evidence one way or the other.
However, given this new context, we held our first ever lunchtime count, between 1230-1330; see table below. This will establish a baseline for the future. Compared to the peak period, as one might expect, the lunchtime count shows fewer cyclists and motorists but, perhaps surprisingly, significantly more commercial vehicles (anecdotally, one of our volunteer counters said this included a lot of private-hire vehicles).
| City centre, time of day | 0800-0900 | 1230-1330 |
| Bikes | 270 | 202 |
| Commercial (bus, taxi, van, etc) | 727 | 788 |
| Private car | 1454 | 1174 |
| Bikes as % of total traffic | 11.0% | 9.3% |
| Single-occupancy cars | 75.4% | 69.7% |
Northbound v Southbound
Perhaps not surprisingly at commuting time, given likely journey distances, many more bikes travel northbound (i.e. towards the city centre) than southbound, whereas as many cars travel south as north. At lunchtime, however, bikes as well as cars are fairly evenly spaced between northbound and southbound.
These patterns result in bikes forming 15.2% of citybound rush-hour vehicles but only 6.8% travelling south. At lunchtime, however, northbound and southbound bikes form virtually identical proportions of the traffic, at 9.4%/9.3%.
Also, although not shown in this table, peak hour northbound bikes grew considerably between Nov 20 and Nov 21, whereas southbound there was actually a slight fall.
| City centre, travel direction | northbound 0800-0900 | southbound 0800-0900 | northbound 1230-1330 | southbound 1230-1330 |
| Bikes | 188 | 82 | 107 | 95 |
| Commercial (bus, taxi, van, etc) | 335 | 392 | 420 | 368 |
| Private car | 715 | 739 | 613 | 561 |
| Bikes as % of total traffic | 15.2% | 6.8% | 9.4% | 9.3% |
| Single-occupancy cars | 80.7% | 70.4% | 68.7% | 70.8% |
Single occupany cars

Now that we also have a lunchtime count, we can see that single occupancy remains high even outside the peak period, although, unlike the peak period, the figures are similar southbound (70.8%) and northbound (68.7%).
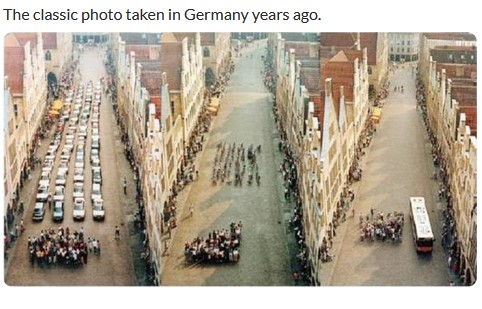
Single occupancy means a huge amount of roadspace occupied to transport just one person, as compared to the space required by a person cycling, walking or using the bus.
In our November 2020 count, with the government deprecating car-sharing, peak-period single occupancy rose to the highest figure we had ever recorded, 79% of all vehicles. In May and November 2021, however, it returned to its normal range in our counts, between 74%-78%. The peak-hour figures split into southbound (70.4%) and northbound (80.7%) were also back to normal ranges.
Finally…
- Full count data are here. See also our count data page for earlier surveys and trends.
- Please retweet our tweet of the count
- Covid brought major changes in commuting patterns, as many people began working from home, and many bus/rail users are thought to have changed to car. This major change, and its impact on numbers and trends, was discussed in our count article of November 2020.
