Our May traffic count, averaged over our 4 regular count points, found bikes forming 19.1% of all vehicles – the highest ever percentage. Bikes comprised more than 1 in 4 of citybound vehicles (26.6%) and exactly 1 in 10 southbound. The total number of bikes rose by 7.2% compared to May 2016.
Latest: Scotsman report Evening News report
In contrast, private cars fell 4.6% from last year, to their lowest ever May level, and down 23% since our first May count, in 2007. We saw a similar pattern of more bikes and fewer cars in our November count, suggesting that this is a real trend.
As usual, we counted bikes, cars and commercial vehicles in both directions on Lothian Road and Forrest Road, on the second Tuesday in May, during rush hour. All figures reported here are for the 8-9am peak hour.
See the full count data and trends from 2006 to the present on our traffic counts page.
LONG TERM TREND
Compared to our first ever May count, in 2007, bikes are up 51% from 366 to 553, whilst cars are down 23% from 1995 vehicles to just 1542.
The combination of more bikes and fewer cars means that bikes have almost doubled as a % of all vehicles, from just 11.9% of all vehicles in May 2007 to 19.1% this year.
This is a success for the Council, which has a bold Local Transport Strategy target to cut car use from 43% of all trips in 2010 to just 31% in 2020, and car commuting from 42% to 29%. The long-term trend of rising cycling and declining city centre car commuting in our counts also ties in with trends in the 2011 census.
There has been relatively little change in commercial vehicle numbers over recent years [our count lumps together buses, taxis, vans and lorries] although there was something of a rise (southbound only) this year.
Once again most cars, 76%, have only one occupant – a huge waste of precious roadspace in the heart of the city. The 2011 Edinburgh census data confirms this picture, and additionally shows that many of the multi-occupant cars are on the school run. Therefore single-occupancy commuting is almost certainly significantly worse than our 76% figure.
LOTHIAN ROAD
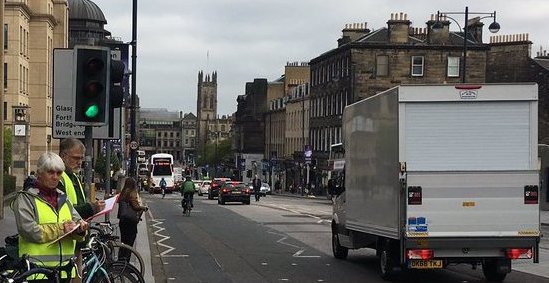
Lothian Road during our peak-period count: a not untypical scene, showing the expanse of roadway crying out for protected cycle facilities. Of the vehicles on the road in this picture, very roughly 25% are bikes, 25% commercial and 50% cars, as in our survey. Photo: Martin McDonnell
Lothian Road saw little change in bike numbers compared to last May, but a major fall in cars – so, citybound, bikes rose from 22.7% of vehicles to 25.8%.
The level of cycling demand surely cries out for protected cycling provision on this relatively wide, but scary, city-centre road – and the falling car numbers should make it politically much easier than a few years ago. There are few roads in the city which would benefit so strongly from such a scheme and, as shown by the London superhighways [video1][video2], there is almost certainly a big pent-up further demand from people who’d like to cycle but don’t feel safe until they have the right conditions.
FORREST ROAD
At Forrest Road we saw the opposite picture with car use virtually static but a 12% rise in bikes, from 268 (northbound+southbound) to 300. Commercial vehicle numbers hardly changed. As a result, bikes formed a record 27.3% of citybound vehicles and a record 14.0% southbound.
NORTHBOUND/SOUTHBOUND
Each of our counts seems to find something that is hard to explain! This time we found a major difference in citybound versus southbound travel trends compared to last May, with traffic significantly up southbound but even more significantly down citybound – a pattern affecting bikes, cars and commercial vehicles. Interestingly, there was no sign of this pattern in our November-November comparisons, so possibly there was some one-off factor today.
Citybound – car numbers fell drastically, commercial vehicles dropped slightly and whilst bike numbers did not fall, they only rose marginally. The drop in citybound car numbers was almost entirely at Lothian Road, down over 20% from 517 to 397. If anyone has ideas why the fall was so large – for example a traffic problem somewhere, causing traffic diversion – please let us know. We have no reason to doubt the count figure, and we have seen occasional changes of this magnitude in previous counts, but there could possibly be a statistical fluke exaggerating a real decline here.
Southbound – cars rose by 7% from 690 to 737, commercial vehicles by 14% from 378 to 431 and bikes were up 29% from 101 to 130. All categories rose significantly at Lothian Road, whereas at Forrest Road only bikes and commercial rose significantly, with car numbers up only very slightly.
WHAT NOW??
The new Council should take every advantage of this great legacy from the last administration to speed up plans to boost cycling (as well as walking and public transport). The continuing decline in car numbers makes it much easier than 10 years ago to re-allocate roadspace. The planned East-West segregated route should be progressed robustly; and there is an ever stronger case for protected cycle facilities from the Meadows to Princes Street [see p7 of Spokes 127] and, perhaps even more so, on Lothian Road.
If you agree – why not speak to or email your councillors?? Tell them about the survey results, and what you’d like to see happening now.
And please retweet our tweet about this story!