The May 17th Spokes city-centre 2022 traffic count found bike numbers continuing their upward trend during our covid counts. Totalled over our 4 city-centre count points (northbound and southbound, Forrest Road triangle and Lothian Road) during the 8-9am peak period, total bike numbers jumped dramatically from 217 last May to 310 this year. The increase was entirely northbound (perhaps commuters returning to city centre jobs) with southbound bike numbers almost unchanged.
Private motor traffic fell somewhat (though see the ‘cautionary note’ below) whilst commercial traffic (taxis, buses, vans etc) stayed fairly static.
As a result, bikes as a percentage of all vehicles rose from 8.9% a year ago to 12.7% now, totalled over the 4 locations, ranging from a high of 21.5% northbound 8-9am at Forrest Road, to the lowest count of 5.5% southbound lunchtime at Lothian Road.
Totals from the 4 counts we have undertaken during the pandemic are in the table below. The weather was reasonably good for all counts, so had little impact on the changes.
| City centre, 8-9am | Nov 2020 | May 2021 | Nov 2021 | May 2022 |
| Bikes | 229 | 217 | 270 | 310 |
| Commercial (bus, taxi, van, etc) | 679 | 706 | 727 | 728 |
| Private car | 1321 | 1507 | 1454 | 1403* |
| Bikes as % of total traffic | 10.3% | 8.9% | 11.0% | 12.7% |
| % of cars which are single-occupant | 79.0% | 76.4% | 75.4% | 77.7% |
*Cautionary note: For the May 2022 count, North Bridge was closed to all northbound traffic, for major refurbishment works. This is likely to significantly affect traffic flows at other south-north city-centre crossings. However, in our count, car numbers at Lothian Road were little changed; whilst at Forrest Road, instead of the expected rises in northbound car and commercial traffic, to compensate for the North Bridge closure, there were significant falls. The reduction was even greater in a separate lunchtime count (compared to November 2021, as we did not do a May 2021 lunchtime count). We welcome comments from anyone who can cast light on this very unexpected result. It is possible there was some unknown factor at play, such as traffic light problems nearby, in which case car numbers at this location may rise again in our next (November) count.
Outside the peak hour
The covid experience brought substantial changes in travel patterns, highlighting the need to count during the day as well as in the morning peak. Thus we held our first ever lunchtime count in November 2021, and did the same this May.
The table below shows very little lunchtime change between November 2021 and May 2022, with a slight decline in all modes, leaving cycling almost identical (9.3%/9.2% of traffic) in both counts. However, there are clear differences between commuter and lunchtime patterns, with much higher bike and car use at commuter time, and bikes forming a higher percentage (12.7%) of all traffic than at lunchtime.
| City centre, count date | 2.11.21 | 17.5.22 | 17.5.22 |
| Time of day | 1230-1330 | 0800-0900 | 1230-1330 |
| Bikes | 202 | 310 | 178 |
| Commercial (bus, taxi, van, etc) | 788 | 728 | 718 |
| Private car | 1174 | 1403 | 1041 |
| Bikes as % of total traffic | 9.3% | 12.7% | 9.2% |
| % of cars which are single-occupant | 69.7% | 77.7% | 70.1% |
Northbound v Southbound
Perhaps not surprisingly at commuting time, given likely journey distances, many more bikes travel northbound (i.e. towards the city centre) than southbound, whereas as many cars travel south as north. At lunchtime, however, bikes as well as cars are fairly evenly spaced between northbound and southbound.
These patterns result in bikes forming 17.5% of citybound rush-hour vehicles but only 7.5% travelling south. At lunchtime, however, northbound and southbound bikes form identical proportions of the traffic, at 9.2%.
Interestingly, although not shown in this table, peak hour northbound bikes increased dramatically from 129 to 223 between May 2021 and May 2022 (perhaps people returning to offices) whilst cars declined somewhat.* Southbound showed little change in any mode between last year and this.
| City centre, travel direction | northbound 0800-0900 | southbound 0800-0900 | northbound 1230-1330 | southbound 1230-1330 |
| Bikes | 223 | 87 | 83 | 95 |
| Commercial (bus, taxi, van, etc) | 359 | 369 | 338 | 380 |
| Private car | 695 | 708 | 486* | 555 |
| Bikes as % of total traffic | 17.5% | 7.5% | 9.2% | 9.2% |
| % of cars which are single-occupant | 78.0% | 77.4% | 70.4% | 69.9% |
*This may be unrealistically low – see ‘Cautionary note’ above.
Single occupany cars
Now that we also have a lunchtime count, we can see that although single occupancy remains high at all times, it is worst in the peak period at 75%-80% compared to around 70% at lunchtime – the same was true in our November count. As regards direction of travel, both northbound and southbound were equally bad for single occupancy.
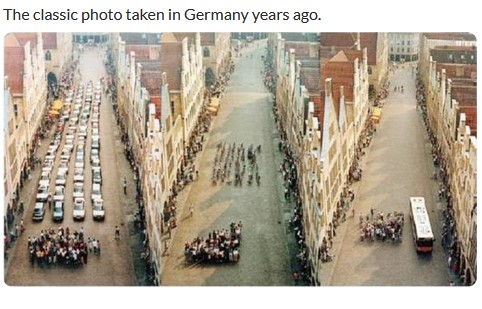
Single occupancy means a huge amount of roadspace occupied to transport just one person, as compared to the space required by a person cycling, walking or using the bus. The increasing presence of SUVs makes this disparity even worse.
Portobello count
Spokes Porty now does a traffic count in Brighton Place at the same times as our City Centre counts. A report is expected on their blog in due course.
Porty bike numbers increased marginally from May 2021 (up from 76 to 81) but commercial and car slightly more (commercial from 149 to 174; car from 545 to 612). As a result bikes formed 9.3% of all traffic, compared to 9.9% in May 2021.
The 12% rise in cars over the year is probably a post-covid effect, with more in-person activity and reluctance to use bus. In contrast, our city centre count found car numbers falling, but that may be misleading, as explained in the ‘cautionary note’ following the first table above. However there were also Porty road changes since the previous count, with closures at Brunstane Road and at Mountcastle Drive South, so the figures are hard to interpret.
Policy lessons
The Scottish Government in December 2020 made a remarkable “commitment” (not just a “target”) to reduce car-km 20% by year 2030; and Edinburgh City Council following this up with an even tougher (target) of 30%. See background and links in this article.
Edinburgh Council also has plans for Portobello to become a ‘20-minute neighbourhood‘ i.e. a car-reduced neighbourhood where residents can access most of their daily services and amenities in a single 20-minute round trip, either by walking, cycling, taking public transport or using wheelchairs and other ‘wheels’ like scooters or prams
The rise in car use at Portobello, and the possibility that city centre car use is static, or even rising, emphasise the need for the Council to progress rapidly with implementing its on-paper policies for car demand-management, as in the City Mobility Plan (p44) , 20-minute neighbourhoods and City Centre Transformation.
Finally…
- Full count data are here. See also our count data page for earlier surveys and trends.
- Please retweet our tweet of the count
- The report on our previous (November 2021) count is here
- Covid brought major changes in commuting patterns, as many people began working from home, and many bus/rail users are thought to have changed to car. This major change, and its impact on numbers and trends, was discussed in our count article of November 2020.