The biannual Spokes traffic count, on November 7, found a continuing (but small) rise in bike traffic, and a continuing (but small) fall in private motor traffic, as compared to November 2022. As a result, bikes between 8-9am rose to 14.8% of all vehicles, from 14.5% in 2022; and to 8.4% from 7.9% at our lunchtime (1230-1330) count.
| Totals at Lothian Rd & Forrest Rd northbound & southbound | Nov 2022 8-9am | Nov 2023 8-9am | Nov 2022 1230-1330 | Nov 2023 1230-1330 |
| Bikes | 358 | 365 | 142 | 156 |
| Commercial (bus, taxi, van, etc) | 688 | 703 | 710 | 761 |
| Private car | 1415 | 1390 | 956 | 946 |
| Bikes as % of total traffic | 14.5% | 14.8% | 7.9% | 8.4% |
| % of cars which are single-occupant | 74.0% | 75.5% | 67.6% | 70.5% |
The counts were at our usual 4 city centre count locations, Lothian Road and Forrest Road, northbound and southbound, with fairly similar weather both years. Of course, the counts are just snapshots on one day. However, to maximise comparability, we always use the same day of the week, a Tuesday, and the same time of year.
The overall results hid some interesting differences between 2022 and 2023, though the reasons for these are obscure and possibly mainly random. The fact that North Bridge had reopened to 2-way traffic (having been closed northbound in the 2022 count) had no obvious effect on our numbers.
There was a noticeable rise in ‘commercial’ traffic (in which we include van, bus and taxi), particularly at lunchtime. Indeed, this was one reason why the growth in the bike traffic % was not greater. Interestingly, whilst bike and car both fell noticeably northbound 8-9am on Lothian Road, bus/taxi/van rose.
The slight rise in overall bike numbers masked the fact that the northbound total was down at 8-9 and 1230-1330 (with a significant 8-9am drop at Lothian Road, from 140 bikes in Nov 2022 to 116 this year). However total southbound bikes were well up at both time slots (with significant rises at Forrest Road), more than compensating for the northbound fall.
Unsurprisingly, top scoring bike spot was Forrest Road northbound at 8-9am, where bikes comprised 22% of all vehicles.
Car numbers at 8-9am were not much changed from 2022 (though, like bikes, with a drop at Lothian Road). More puzzling, particularly with North Bridge reopening northbound, lunchtime car numbers at our count points were up very substantially northbound (from 405 in 2022 to 491 in 2023) and down equally substantially southbound (from 551 to 455).
Car single occupancy
Single occupancy rose, morning and lunchtime, compared to 2022. It is highest in the morning northbound slot, at nearly 80% of all cars, taking up huge roadspace per person at the busiest time of day and in the busiest direction. Southbound in the morning, and in both lunchtime directions, single occupancy was still a space-hogging 70% or so of all cars.
Covid recovery
Covid made a massive change to travel patterns, including an initial huge decline in morning bike, car and bus commuter travel, although car trips fell proportionately least – probably because some commuters who could not work from home transferred from bus to car, to isolate themselves from other people.
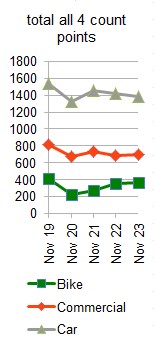
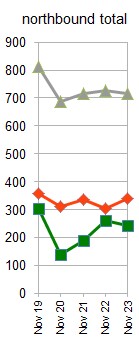
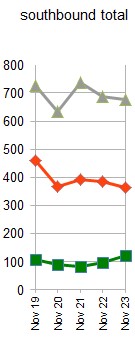
The main travel shock now appears to be stabilising, with the new picture showing rush-hour bikes almost back to Nov 2019 pre-covid numbers, and on a continuing but slower upward trend following the initial 2021 recovery. Cars, however, are down both northbound and southbound, and are now on a downward trend following their initial 2021 partial recovery. For both bikes and cars, northbound (i.e. citybound) travel has declined the most, with a lesser decline for southbound cars and a rise for southbound bikes.
The 3 graphs below show total, northbound and southbound 8-9am data from November 2019 to the present.
Traffic Reduction policies – Council and Government
It is disappointing that both the Council and the Scottish Government did little to build on the initial big fall in car use during Covid, and allowed it to recover significantly, despite Edinburgh’s ‘target’ to reduce car-km 30% by 2030, and the Scottish Government’s ‘commitment’ to reduce car-km 20% by 2030. Indeed the Scottish Government deliberately delayed publishing its draft car-km reduction plan for a year or so until January 2022 to allow car numbers to recover – and the final version has still not appeared, another 2 years later!
Northbound v Southbound
Despite the above-mentioned fall in northbound bikes, many more bikes still travel northbound (i.e. towards the city centre) than southbound at commuting time. This is not surprising, given likely journey distances. At lunchtime, however, bikes are fairly evenly spaced between northbound and southbound. Car numbers are fairly even between north and southbound at both times of day.
These patterns result in bikes forming nearly 20% of citybound rush-hour vehicles, compared to around 10% southbound and, at lunchtime, 8%-9% in both directions.
| City centre, travel direction | northbound 0800-0900 | southbound 0800-0900 | northbound 1230-1330 | southbound 1230-1330 |
| Bikes | 242 | 123 | 75 | 81 |
| Commercial (bus, taxi, van, etc) | 340 | 363 | 356 | 405 |
| Private car | 715 | 675 | 491 | 455 |
| Bikes as % of total traffic | 18.7% | 10.6% | 8.1% | 8.6% |
| % of cars which are single-occupant | 77.5% | 71.6% | 70.3% | 70.8% |
Portobello count including City Centre comparison
Spokes Porty now does a traffic count in Brighton Place at the same times as our City Centre counts.
Results were almost identical to November 2022, with very marginal declines in bike and car numbers, and a slight rise in van/bus/taxi.
Like last November, bikes were concentrated into the 8-9 slot, whereas cars were only slightly fewer at lunchtime as compared to morning.
| Portobello, Brighton Place [eastbound + westbound] | Nov 2022 0800-0900 | Nov 2023 0800-0900 | Nov 2022 1230-1330 | Nov 2023 1230-1330 | Nov 2022 am+pm | Nov 2023 am+pm | |
| Bikes | 58 | 59 | 14 | 11 | 72 | 70 | |
| Commercial (bus, taxi, van, etc) | 84 | 88 | 93 | 101 | 177 | 189 | |
| Private car | 313 | 328 | 299 | 270 | 612 | 598 | |
| Bikes as % of total traffic | 12.8% | 12.4% | 3.5% | 2.9% | 8.4% | 8.2% | |
| Single occupancy | 70.0% | 74.7% | 75.9% | 65.9% | 72.9% | 70.7% |
Another difference (not shown in the table above) was that during the 8-9am period, bikes were predominantly travelling westbound (away from Porty), 37 bikes westbound versus 22 eastbound; whereas car numbers were similar in both directions, 158 westbound and 170 eastbound. Bike numbers at lunchtime were too low for firm conclusions, but were predominantly towards Porty.
Car single-occupancy was highest in the rush-hour, as with the city centre count. It was particularly low at lunchtime, a puzzling finding given that it had been high at lunchtime in November 2022. However, single-occupancy can be hard to judge, so these figures cannot be taken as definitive.
Policy questions and lessons
- Again, we emphasise that our counts are one-day snapshots, and only during two one-hour slots; but they do suggest trends, some hopeful, some concerning, which need thought and attention
- As mentioned above, the Scottish Government in December 2020 made a remarkable “commitment” (not just a “target”) to reduce car-km 20% by year 2030; and Edinburgh City Council following this up with an even tougher “target” of 30%. See background and links in this article. Our data suggests that the Council is well off track so far, and if that is the case in a big city then the Scottish Government commitment may well be in an even worse position.
- Post-covid traffic patterns are beginning to stabilise. Waiting to see what happens is no longer a credible policy for the government, if it ever was.
- Although the difference in trends between city centre and Portobello are not great between the 2022 and 2023 Novembers, the city centre does have a slightly better trend away from car use. It would be useful to know, and concerning, if car use is more resistant to change in all non-central areas, or if it is specific to Portobello, perhaps because it is the nearest seaside opportunity for city dwellers. In any case, Edinburgh Council’s plans for Portobello to become a 20-minute neighbourhood should be treated urgently.
Resources …
- Full count data are here. See also our count data page for earlier surveys and trends.
- Please retweet our tweet of the count
- The report on our November 2022 count is here
- Covid brought major changes in commuting patterns, as many people began working from home, and many bus/rail users are thought to have changed to car. This early major change, and its impact on numbers and trends at that time, which may still be influencing traffic patterns to some extent, was discussed in our count article of November 2020.